Creating accessible tables in Citizen Space
Tables are a useful way to present various types of data in rows and columns. They allow a user to make quick connections between different types of data.
You can add tables directly onto the page, rather than using images or PDFs, for improved accessibility. If you add a table as an image, by taking a screenshot for example, respondents using screen-readers will hear only the alternative text attached to an image, whilst by using an HTML table, all the information in the table is able to be interpreted and read out to your respondent.
Tables can be easily added to your Citizen Space activity anywhere you see the text editor bar.
How to add / edit a table
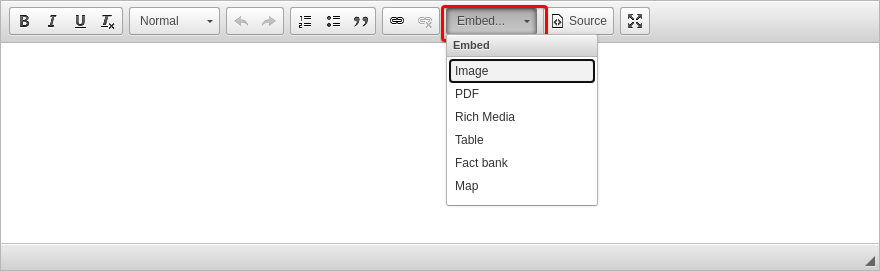
To add a table, place the cursor wherever you would like the table to be inserted and select the 'Embed' button in the text editor bar, and then select 'Table' from the dropdown list.
You will then be presented with some options of how you would like it to be displayed:

- Rows - enter the amount of rows you would like
- Columns - enter the amount of columns you would like
- Headers - select if you would like you headers in the first row, first column or both
- Align - you can align you table to the left, centre or right of any text you have already added (the table needs to be set to less than 100% width)
- Caption - a free text box that lets you add a title or subject which will appear just above your table
- Width - choose as a percentage, the width you would like your table to take up on the page
- Height - choose the height in pixels you would like your table to be
You are able to edit any parts of the table by right clicking anywhere within the table and selecting the option you would like to change.
Accessibility and tables
Using the right settings for your table ensures that you have an accessible table.
Caption
A caption summarises the overall topic of a table and is useful in most situations. Although not all tables need captions, it's recommended you either provide a caption or include a heading above the table. Captions are also helpful for people navigating from table to table on the same page.
The caption appears centred above the table in Citizen Space.
Headings
Proper table headings are required in order for the data to be interpreted correctly. The structural markup set up in table properties is used to differentiate and properly link header and data cells, and without it creates accessibility barriers. Relying on visual cues, such as bold text alone, is not sufficient to create an accessible table.
Tables must:
- always have a header row, which explains the content of the columns
- use capitalised headings in header columns and rows
- have row headings in column one (if row headings are present in other columns, then the table needs to be either rearranged or divided).
By setting header columns and / or rows, you enable:
- people using screen readers to have the row and column headers read aloud as they navigate through the table
- screen readers to speak one cell at a time and reference the associated header cells, so the reader doesn’t lose context
- and people can use alternative ways to display the data, for example by using custom stylesheets to display header cells more prominently, change text size and colours, or display the information as lists rather than grids.
To set the headers, in 'Table Properties' select if you would like you headers in the first row, first column or both.
Government Digital Service has a great video on how screen readers use headings and why headings are important. Check out GDS info on tables for more helpful tips.
Where to use a table
A nice way to use tables is in an introduction or fact bank to provide more information to your respondents on a particular topic or question within your activity. We have written an article on 'fact banks' and how to use them which provides more detail. Our article on turning detailed documents into online survey activities gives lots of examples of how to make your data come alive.
Table example:
| Event | When | Where |
|---|---|---|
| Writing For Children Workshop | 21/11/2013 | Town Hall |
| Book Festival 2013 | 01/12/2013 | Central Library |
| Literacy Testing | 03/12/2013 | Central Library |
| Poetry Matters | 21/12/2013 | Arts House |
When using tables, do not:
- use tables to position text or lay out elements on a page
- create overly complex tables or nest tables within each other
- use tables for aesthetic reasons, for example to present a list because you think it looks better that way.
A note about pasting from Word:
Please be aware that tables cannot reliably be copied and pasted directly from Word, as Word formatting does not talk to websites well. This means that the way your table looks can vary according to the browser you and your respondents are using and may mean lines go missing, cells and wording may move and things such as colours and styling will not carry across. It also doesn't retain the semantic structure needed to make to your table accessible. This is not unique to Citizen Space and is true of copying and pasting from Word into any site.
More information on HTML and accessibility
If you want to know more about accessible tables, there's also a great article from DigitalA11y on accessibility and tables with even more resources.