Analysis - Quick start guide
How to get started with analysis
We've got a lot of articles on analysis to help you through the process. You might want to start with the following:
- How to design your activity for effective analysis
- How to manage the analysis process
- Reporting back on your results
Let's jump in at the second stage of the process and assume that you've got some responses already and you want to analyse them. There are various ways of looking at the responses. Take a look at the different analysis options.
With regards to this article, we’ll be looking at the following topics:
Responses by Question
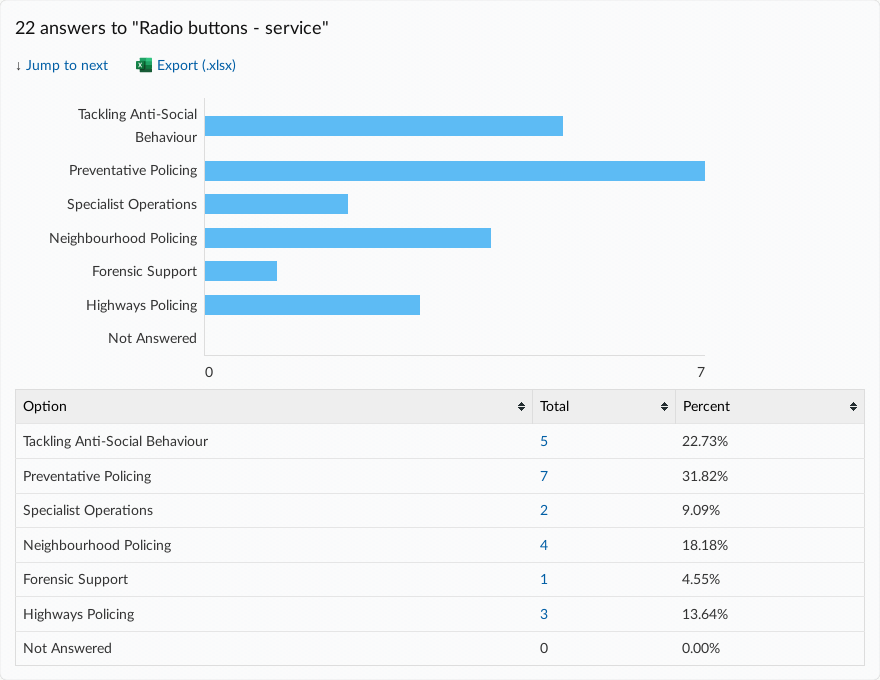
When you begin analysis, it's likely that your first port of call will be 'Responses by Question'. This is accessed by selecting 'View responses', found in the 'Responses' section of the activity navigation bar

This lets you view how each question in your activity has been answered by all respondents.
To add another layer to your analysis, you can use our filtering and grouping tools, which allow you to compare responses to one question against responses to another question. Filtering lets you see only the responses that gave a specific answer to a question. Grouping shows you all responses to that question, but it will allow you to see how respondents answered this question in relation to another other selected question.
Example
Let's imagine that Question 1 asks "Where do you live?" and offers the answer options North, East, South and West.
Question 2 asks "How would you rate the service?" and offers the answer options Good, Average and Poor.
Filtering allows you to extract all respondents who have given a specific answer to that question e.g. If you go into Question 1, you can then filter to get only those respondents who answered 'North'.
Grouping allows you to see the breakdown of responses to one question in relation to the answers to another e.g. If you go into Question 1 and then group the answers with those from Question 2, you will see a table of percentages and response numbers for all combinations answer options. This would show you the number of respondents who live in the North and also rate the service as Good, or live in the South and think the service is Poor.
It is possible to include or exclude 'not answered' from the charts or graphs, which you can read more about in our article detailing that option.
Viewing responses by respondent
When looking at a question in 'Responses by question', selecting a particular answer will take you through to 'Responses by Respondent'. This will show you the individual respondents who gave the same response to that question.
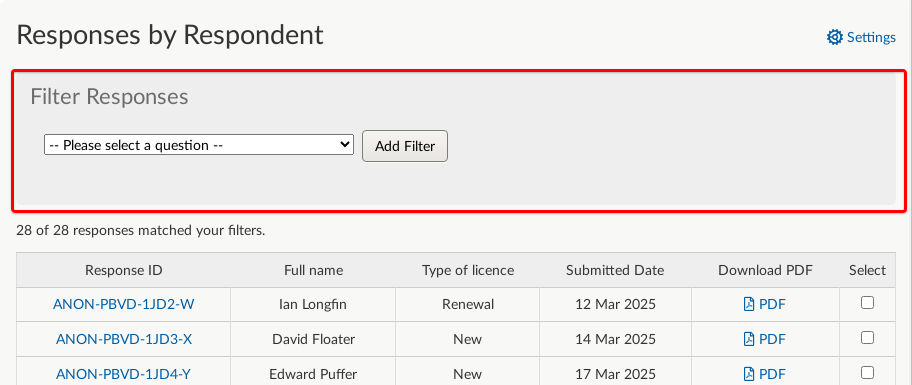
Selecting the response ID link will show you that individual's response to the entire activity.
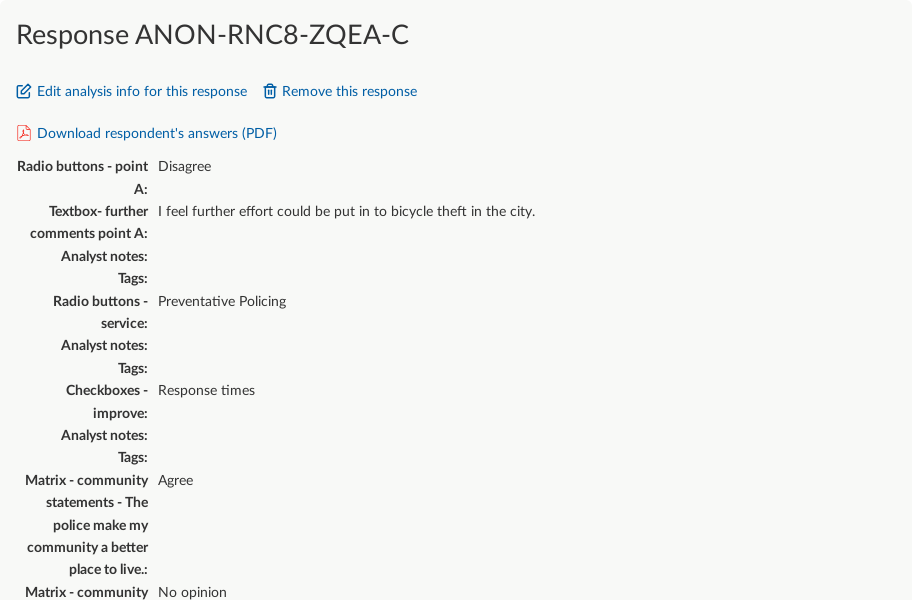
You now have the option, as an analyst, to add some interpretation to the response. At the top of the response summary, select 'Edit analysis info for this response'. This takes you through to 'Analyse Responses'. You can then go through all of the questions the respondent answered, and add analysis information in two ways: by adding text into the 'Analyst only' box under each question, or by tagging responses.
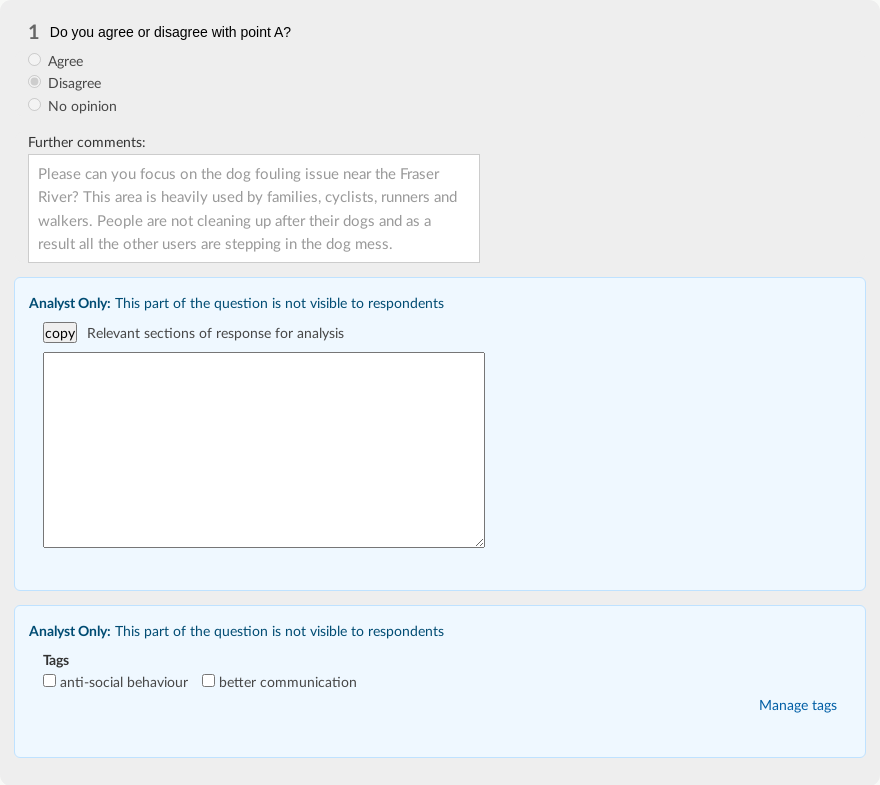
This article explains what tagging is (you might call this coding), and how it can fit in to your analysis process; this one takes you through the practicalities of the process. Essentially, it's a method of changing qualitative data (free text added by respondents) into quantitative data (numbers and percentages).
Analyse and tag responses
Analyse and tag (linked from the 'View responses' found in the 'Responses' drop down of the activity navigation bar) allows you to read full responses one by one, clean up data and tag (or code) responses for easier analysis.
To help your workflow, you can tick off responses when you've analysed them by checking the box next to 'Is analysis of this response complete?' in the yellow header.

Exporting responses
In some cases, you may find it easier to export data from Citizen Space so that you can use other analytical tools, particularly if you are experienced in analysis using Excel or SPSS. You can download an .xlsx file of your response data by following the steps in this article. There are a couple of things about the way that data is exported that it's good to be aware of.
You can take exports of the full data set, or drill down into the data using responses organised by question, filtering and grouping, as explained above.