The .docx summary report - what does it include
The .docx summary report is an editable version of the PDF summary report, intended to be a useful head-start on creating your own bespoke report.
It's not identical to the PDF summary report - it doesn't contain the index at the start or any logos - but is designed to be a pared-down template, giving you the flexibility to customise how information is presented and what content is included, so you can edit to add your own logo(s), colours and additional context tailored to your specific needs.
In this article we’ll discuss the following:
- How does the report deal with quantitative questions?
- How does the report deal with qualitative questions?
- How to generate the .docx summary report
- Download a filtered summary PDF report
How does the report deal with quantitative questions?
Quantitative questions offer respondents the option to select either:
- one answer from selections provided, e.g. radio buttons, dropdown lists, single tick-boxes;
- or multiple answers from selections provided, e.g. checkboxes.
The answers for each quantitative component are displayed in a chart followed by a table:

How does the report deal with qualitative questions?
For text and other qualitative questions, the total number of responses to that part of the question is shown, but qualitative answers are not included in the report in order to keep the data anonymous:

Tags from qualitative responses will not show in the summary report. A full export of all responses, or all responses including analyst fields (such as tags), can still be downloaded in .xlsx format at any time.
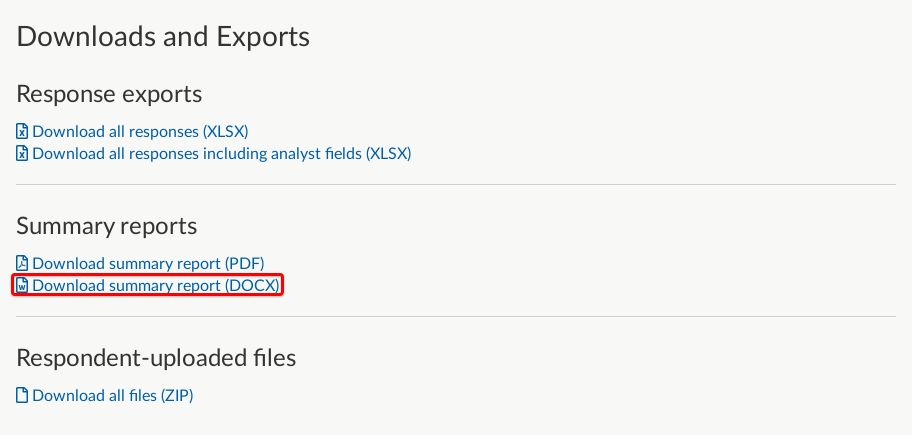
How to generate the .docx summary report
At the top of the dashboard, go to the dropdown menu Responses and select 'Downloads and exports'. The second heading down on this page is 'Summary reports' and you will see links to download the summary report as either a PDF or an editable Word document.
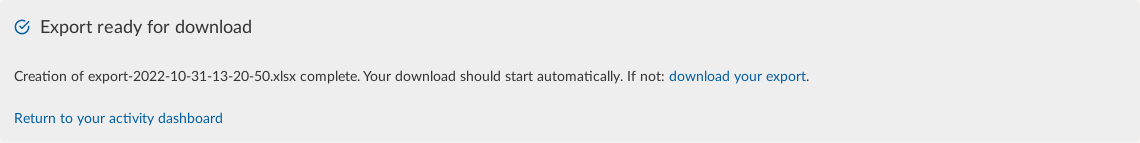
When you select the link to generate the .docx report, you will be shown the report request page, showing progress as the report is generated (this is the same as when a .xlsx export is requested):
Download a filtered summary .docx report
Cut straight to the information you need by adding a filter for the data you want to include in a report in 'Responses by question'. Then download a filtered summary report .docx.

The filtered report will give you the same charts and tables you’re used to seeing in a full .docx summary report, but now excluding any data you’re not interested in.
You can find 'Responses by question' by going to the dropdown menu Responses at the top of the dashboard and selecting 'View responses'. Then go to the sidebar menu on the left-hand side of the page and select 'Responses by question'.