Filtering and grouping of responses
Citizen Space's powerful filtering and grouping tools can be used to cross-reference respondents' answers and help you look for patterns, trends and relationships in the data.
Filtering allows you to look at how a question was answered only by a specific group of respondents (e.g. matching a particular age group, or from a certain area) and you can layer up multiple filters.
Grouping allows you to directly cross-reference responses between 2 questions (for example seeing all the answers to a particular question cross-referenced by age group).
Filtering responses
Step 1
On the activity's navigation bar, go to the dropdown menu Responses and select 'Analyse responses'. In the sidebar menu on the left-hand side, you can then select either Responses by respondent or Responses by question.
Step 2
If using 'Responses by respondent'
Under Filter responses by question, select the question you want to filter by and select 'Add Filter'. As well as filtering by question, you also have the option to select from 4 additional filters. These additional filters allow you to filter responses by response ID; by whether or not a response has been analysed; by the date the responses were submitted; and by which pages of the activity the respondent visited.

Tick the box next to the answer you want to filter by and select 'Apply'.

You will now only see the responses that answered that question according to your selected criteria. You can keep adding filters to narrow the number of responses down in the same way.
To remove a filter, just select 'Remove' on the one you wish to get rid of. You can also select the 'Clear All' button which will clear all filters and any grouping applied.
If using 'Responses organised by Question'
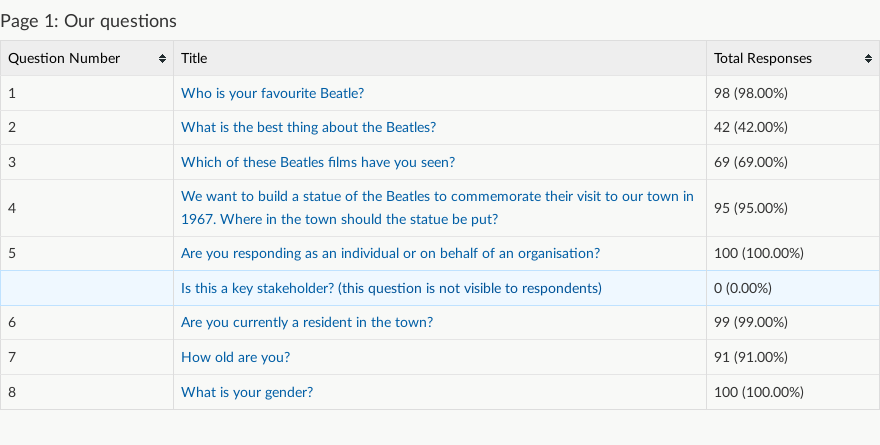
Select the question you want to apply your filter to. For this example, we are going to look at the question, 'Who is your favourite Beatle?'.

Select the question or additional filter you wish to filter by from the dropdown list and then 'Add Filter'. You will now see the filtering and grouping box.


Based on the example in the above screenshot, we are now seeing only the responses from those who chose John as their favourite Beatle — which is 29 respondents.
You can narrow this down further by filtering with the 'How old are you?' question. To do that, select the 'How old are you?' question from the drop down, then 'Add Filter'. You can select more than one option — in this example the '30 or under' and '31-45' age brackets are selected to enable us to see responses from anyone who selected George as their favourite Beatle and is from the 30 or under and 31-45 age brackets.


In this case, 12 respondents selected John as their favourite Beatle and are either 30 or under or 31 to 45 years old.
You can keep adding filters in the same way to continue to narrow the number of responses down.
To remove a filter, just select 'Remove'.
Grouping responses
Step 1
At the top of the dashboard, go to the dropdown menu Responses and select 'Analyse responses'. Then in the sidebar menu on the left-hand side, select 'Responses by question'.
Step 2
Select the question you want to cross-reference from. We are going to stick with the question, 'Who is your favourite Beatle?' to show the difference between filtering and grouping.

Step 3
As with filtering, once you've selected a question you will see the filtering and grouping box.
We want to group 'Who is your favourite Beatle?' by answers to the question 'How old are you?', so we select this option from the grouping drop down menu:

Then select 'Apply' to apply the grouping. Now we can see how the question was answered according to the respondent's answers to two questions — both in a table and a chart. The table features the colour coding key to explain what the breakdown of colours on the bars of the chart represents.

As with filtering, it is possible to include or exclude 'not answered' from the charts or graphs, which you can read more about in our article detailing that option.
Download filtered summary PDF or .docx report
There is the option to download a summary report based on your applied filters and display options. Set any filters and display options and then select your preferred filtered summary report format to download in 'Responses by question'.

Removing your filters and/or groupings
You can do this one by one by selecting the 'x' by each filter, or returning the grouping dropdown to 'Please select'. However, if you want to remove all the filters and any grouping you have applied, select the 'Clear all' button.

.png)