The PDF Summary report - what does it include
In this article we’ll discuss:
- What does the PDF summary report include?
- How does the report deal with quantitative questions?
- How does the report deal with qualitative questions?
- Generating the report
- Download a filtered summary PDF report
What does the PDF summary report include?
The report contains aggregated numeric data and charts showing the responses received. All data is anonymous, so this report is suitable for publishing straight to the web.
If the activity is still running when the report is generated, an interim report is created.
It also includes:
- The site wide logo, or any custom logos associated with that specific activity - these are displayed at the top of the report.
- A table of contents - the first page of the report has this broken down by survey page and question title.
- A section for each question, which may be presented in several ways depending on the question type.
How does the report deal with quantitative questions?
Quantitative questions offer respondents the option to select either:
- one answer from selections provided (radio buttons, dropdown lists, single tick-boxes)
- or multiple answers (checkboxes)
The answers for each quantitative component are displayed as a bar chart and in a table

How does the report deal with qualitative questions?
For text and other qualitative questions, the total number of responses to that part of the question is shown, but qualitative answers are not included in the report in order to keep the data anonymous, (a full export of all responses can still be downloaded in .xlsx format at any time).
Note: Tags from qualitative responses will not show in the summary report.
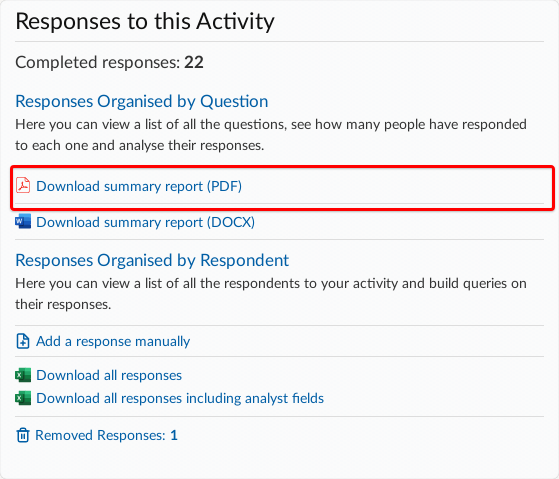
How to generate the PDF summary report
At the top of the dashboard, go to the dropdown menu Responses and select 'Downloads and exports'. The second heading down on this page is 'Summary reports' and you will see links to download the summary report as either a PDF or an editable Word document.
Once selected, the user will see the report request page, showing progress as the report is generated.
Download a filtered summary PDF report
Cut straight to the information you need by adding a filter for the data you want to include in a report in 'Responses by question'. Then download a filtered summary report PDF.

The filtered report will give you the same charts and tables you’re used to seeing in a full summary PDF report, but now excluding any data you’re not interested in.
You can find 'Responses by question' by going to the dropdown menu Responses at the top of the dashboard and selecting 'View responses'. Then go to the sidebar menu on the left-hand side of the page and select 'Responses by question'.