What is tagging?
In this article we’ll look at:
What is tagging?
Tags enable us to condense and convert qualitative answers (i.e. text) into more specific, quantitative data that we can then more easily analyse, report and use to inform our decisions. Tagging (also known as "coding") responses also allows for key themes to be picked out of an individual's response, for example:

Tags may be used to denote themes, sentiments, and alternative answer options that can be filtered and grouped during analysis. Tagging in this case pulls out certain key points of the response.
When can I add tags?
Tags can be added and applied when you're adding questions to your online survey or afterwards in 'Analyse responses' when you're carrying out your analysis.
It's important to note that tags are applied on a per question basis - that is, if you want the same tag on every question in your survey you will need to add it. You only have to set up a tag on a question once and then the tag will be available for every response to that question. There is no limit to the number of tags that can be added. Once tags are added, they can be selected when appropriate on a per response basis.
Tags are visible to the analyst(s), the activity owner(s), Workspace Admin(s) in that workspace and Site Admins. Tags are not visible to the public.
It's possible to add tags at any stage of the process. We recommend that, whenever possible, you set up your tags at the same time that you set up your respondent questions. This will allow for consistent analysis across all responses.
How can I use tags during analysis?
Tags can be used for picking out key themes within qualitative responses, and can then be used for filtering, grouping and exporting. You can see the tags that you've applied in a few different places.
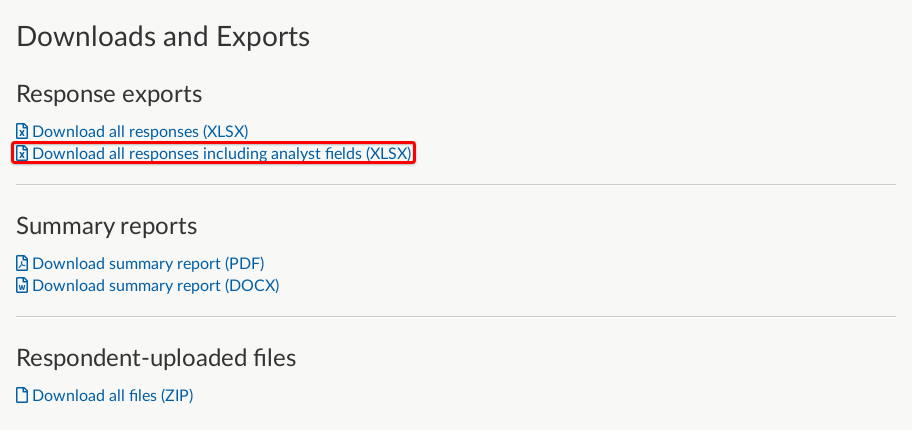
Response data including tags can be downloaded as an .xlsx file. To download this file, on the activity's navigation bar, go to the dropdown menu Responses and select 'Downloads and exports'. The second link on this page, under the heading 'Response exports', is 'Download all responses including analyst fields (XLSX)' and will include any tags you have added so far.
When a question has had tags applied, these are displayed in extra columns in the .xlsx report (one extra column per tag).

It's also possible - and super powerful - to group and filter by the tags you've applied in 'Responses by question'. The filtering and grouping tools can help you to identify patterns, trends and relationships within your data. Our article on how to use filtering and grouping of responses has more information.